
http://lars-frogner.github.io/Astrophot ... nload.html
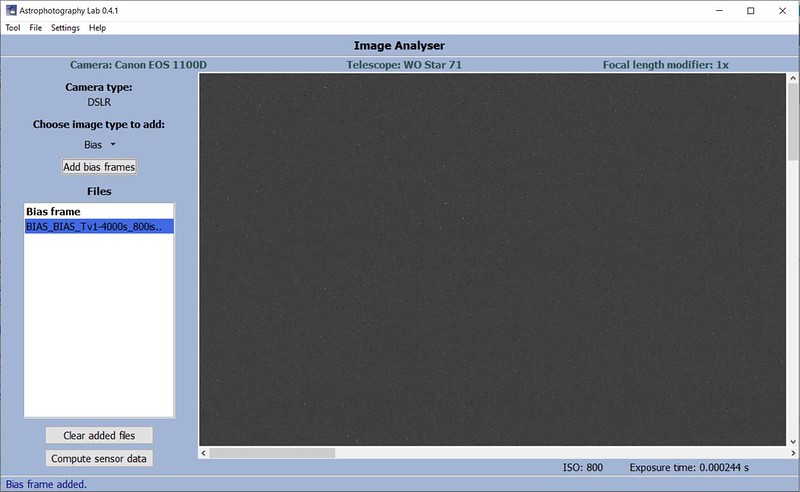
Start the program and the Image Ananlyzer window will open and will look similar to the image below.

INPUTTING CAMERA & TELESCOPE INFORMATION
1) Go to Settings (at the top)/Camera/Change camera and select your camera from the dropdown list. If your camera isn't listed, click the Add new camera button to enter your camera information manually. Selectinging the Use as default box will remember the camera information the next time the program is started.
2) Go to Settings/Telescope/Change telescope and select your telescope from the dropdown list. If your telescope isn't listed, click the Add new telescope button to enter your telescope information manually. Select the Use as default box if appropriate.
3) If you have a Barlow lens or Focal Reducer, go to Settings/Change
INPUTTING REQUIRED SENSOR NOISE IMAGES
You will be required to load 8 images into the program: 2 Bias, 2 Flat, 1 Saturated, 1 Light (target), 2 Dark. All of the images should be taken at the same ISO setting. In addition, the Light and Dark frames should be taken with the same exposure times. While not required, I found it convenient to gather all the images into a single folder to make loading them into the program easier.
4) Under Choose Image type to add there is a drop down list. Make sure Bias is selected.
4a) Click on the Add bias frames button and navigate to and select a Bias frame. When the frame is loaded it will be displayed in the Image Analyzer window as shown below.
4b) Repeat step (4a) for the second Bias frame.
5) Under Choose Image type to add there is a drop down list. Make sure Flat is selected.
5a) Click on the Add flat frames button and navigate to and select a Flat frame. When the choice between Red or Green is presented I usually choose Green.
5b) Repeat step (4a) for the second Flat frame. No color choice will be presented for the second Flat frame.
6) Under Choose Image type to add there is a drop down list. Make sure Saturated is selected.
6a) Click on the Add saturated frame button and navigate to and select the Saturated frame. Not all of the pixels in the image need be saturated, but, at least some of the pixels must be saturated.
7) After these 5 images have been loaded, click on the Compute sensor data button and the noise characteristics of the camera will be calculated and presented in the Computed sensor data window as shown in the image below. Clicking on the Save sensor data button will save the sensor information for future use.

For this discussion the most interesting number is the Read noise which is the noise added to each pixel by the camera electronics.
INPUTTING REMAINING IMAGES
8) Under Choose Image type to add there is a drop down list. Make sure Light is selected.
8a) Click on the Add light frame button and navigate to and select the Light frame.
8b) When the Light frame is displayed, Right-click in the image and click on Select mode.
8c) Use the scroll bars to find a dark region of the image (no bright stars, no stars at all if possible), using the cursor Left-click and drag to create a selection box that includes only the dark region. NOTE: The pixels inside this selection box will be used to determine the noise in the image.
8d) Right-click anywhere in the image and choose Transfer data to Image Calculator in the Pop-up window. In the next Pop-up box select Background and click on OK.
8e) Use the scroll bars to find a bright region of the image (target), using the cursor Left-click and drag to create a selection box that includes only the bright region.
8f) Right-click anywhere in the image and choose Transfer data to Image Calculator in the Pop-up window. In the next Pop-up box select Target and click on OK.
9) Under Choose Image type to add there is a drop down list. Make sure Dark is selected.
9a) Click on the Add dark frames button and navigate to and select the Dark frames (2).
9b) When the two Dark frames have been loaded, right-click in the image of either of the two Dark frames and select Transfer data to Image Calculator.
All of the images have now been loaded into the program.
ANALYZING THE IMAGE NOISE
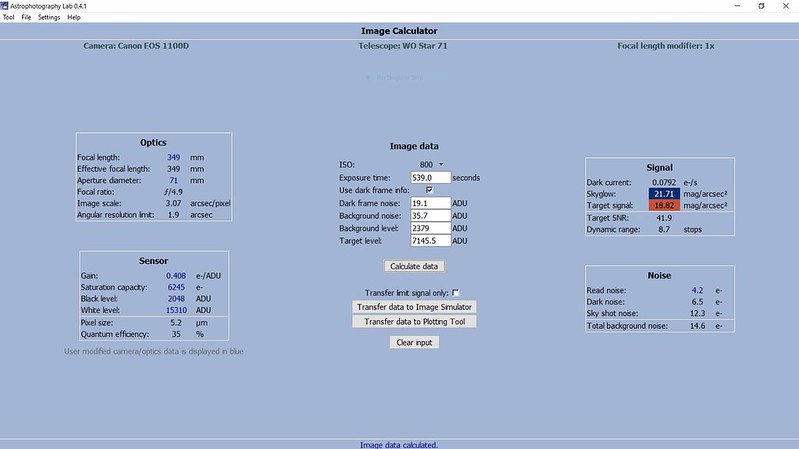
At the top of the screen select Tool/Image Calculator. A window like the one shown below will be displayed, but, your numbers will be different. However, you should have numbers in all the same boxes as shown in the picture.

10) Make sure the Use dark frame info box is checked.
10a) Click on the Calculate data button and the calculations will be presented in the two right-hand boxes (Signal and Noise as shown below.
CREATING THE DESIRED GRAPH
11) Click on the Transfer data to Plotting Tool button.
11a) At the top of the window select Tool/Plotting Tool and a window like the one shown below will appear.

11b) Select Single plots.
11c) Click on the Choose plot type drop-down list and choose Stack SNR vs sub exposure time.
11d) In the Imaging Parameters section enter 3 for the Total imaging time (hours). This number is not important for this discussion, but, you need to have a number here.
11e) Click the Draw graph button and the final result will be displayed on the graph as shown in the image below.

The vertical axis represents IMAGE QUALITY of your stacked images and the horizontal axis is the exposure time for your Light frames. The graph shows that IMAGE QUALITY of the final stacked image improves as the EXPOSURE TIME increases. Not a surprising result, and, this is the reason longer exposures are used. However, although the improvement in IMAGE QUALITY rises quickly, beyond the "knee" of the curve the improvement with increasing EXPOSURE TIME becomes much slower and eventually flattens out. Thus, there isn't a single "best" exposure time. For my system, according to the graph, exposure times beyond about 400 sec will provide very little improvement in the final stacked image. My present choice of 540 sec seems reasonable according to the graph.
If the results don't seem logical maybe this will help. As you take longer exposures the SNR for the individual images improves. However, longer exposures means fewer total images to stack. This combination of effects is why the curve in the graph flattens out for longer exposures.
I hope this makes sense and is helpful. Now, it is time for breakfast and a second cup of coffee.
Steve